- Bitcoin has surged 3% to above $105K, showing optimism as the US Dollar Index drops, eyeing further breakout past $106K resistance to fresh all-time highs.
- Ethereum has risen 5% to $3,400, recovering from its 200-day EMA support at $3,133. XRP has shown volatility recently, with bulls showing signs of exhaustion.
Bitcoin and the broader cryptocurrency market are showing optimism today as the Bank of Japan rate hike comes on expected lines while the US Dollar Index (DXY) takes a dive. With DXY inversely related to Bitcoin and crypto, the market reaction is pretty obvious. The Bitcoin price is up 3%, trading above $105K levels.
At the same time, Ethereum (ETH) price is up 5%, moving to the $3,400 level.
Ripple’s native crypto XRP is up by 2.76%, moving to the $3.20 level.
Bitcoin Price Remains Range Bound, Will It Hold the $100K Support?
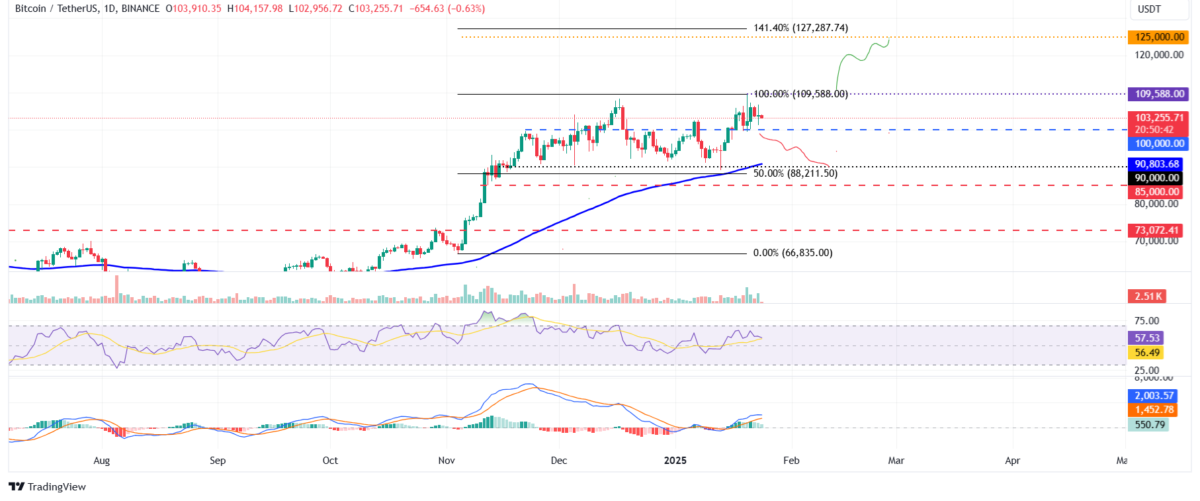
Although the Bitcoin price has witnessed strong volatility over the past week, it has largely remained rangebound oscillating between $101K to $106K. This shows that there’s a tight fight between the bulls and the bears at the support and resistance levels.
However, on the downside, $100K remains a strong psychological support for BTC. If BTC continues to drop and closes below $100,000, it may extend the decline and test the next support level at $90,000. Moreover, other on-chain indicators warrant caution at this stage.
The Relative Strength Index (RSI) on the daily chart is at 57, above the neutral 50 level, but trending downwards, signaling a weakening of bullish momentum. The Moving Average Convergence Divergence (MACD) is also converging. If the MACD forms a bearish crossover on the daily chart, it would generate sell signals and indicate a potential downtrend.

On the other hand, if the BTC bulls manage to hold the $100K support levels and extend the rally beyond its current all-time high of $108K, it can further surge to $125K as per the 141.40% Fibonacci extension level. As reported previously, the hope of Bitcoin reserves by nation-states continues to attract bulls.
Ethereum Price Surges 5% to $3,400, Will It Hold the 200-EMA Support?
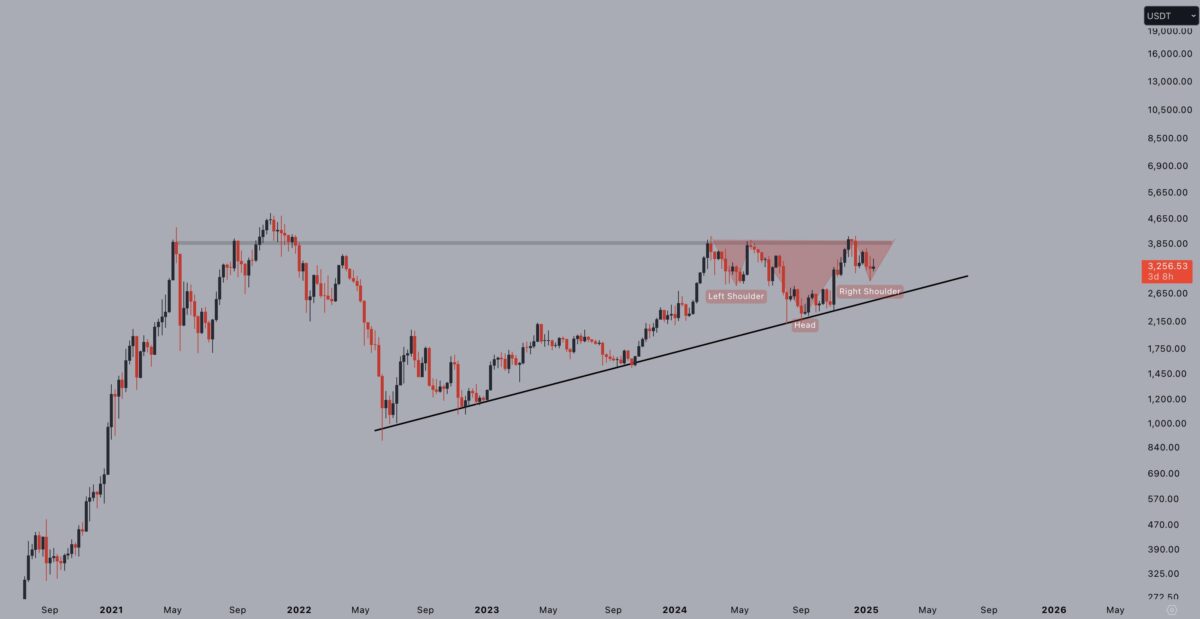
Amid the surge in the broader altcoin market, the Ethereum (ETH) price has jumped by 5%, moving all the way to the $3,400 level. The bulls have staged a strong ETH price recovery from its 200-day Exponential Moving Average (EMA) at $3,133. As far as Ethereum holds above its 200-EMA, it can continue the rally to test its daily resistance level at $3,730.

If ETH closes below the 200-day EMA at $3,133, it may extend the downtrend toward the key psychological support level at $3,000. The RSI on the daily chart is currently at 47, below the neutral level of 50, signaling a weakening of bullish momentum. Additionally, the MACD indicator has converged, suggesting indecision among traders.
Can Ripple Bulls Continue XRP Price Rally?
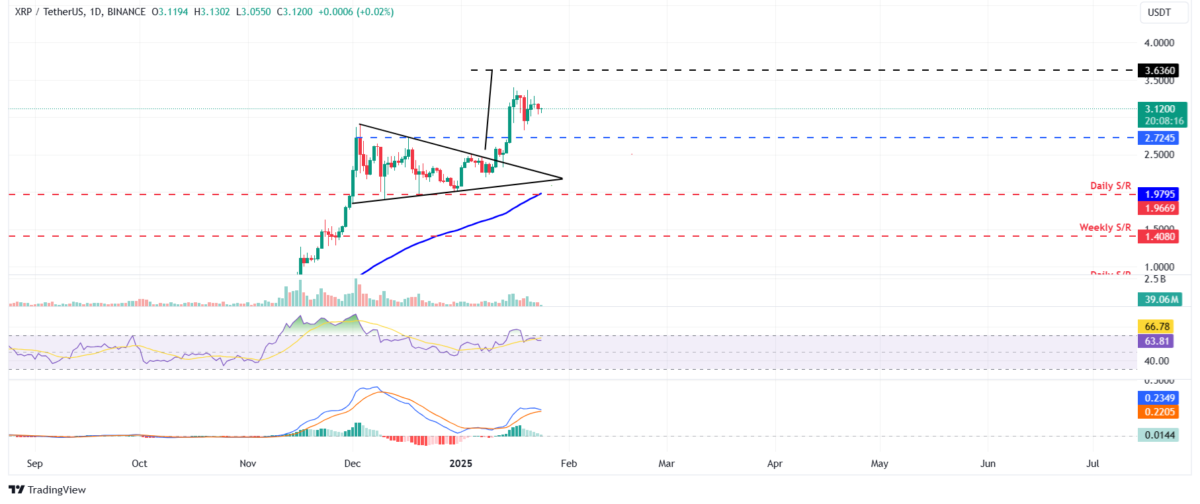
On the technical chart, it is clear that Ripple bulls are showing signs of exhaustion. Over the past week, Ripple’s native crypto has seen strong volatility, with the XRP price swinging between the lows of $2.93 to the highs of $3.30. After a strong rally earlier in January, the XRP bulls have shown signs of major exhaustion.
If XRP maintains its upward momentum, it could extend the rally to reach its technical target of $3.63, based on the current pattern, as previously mentioned in our report.
The RSI indicator is at 63, above the neutral level of 50, but it is trending down after being rejected from the overbought level of 70 on Saturday, signaling a weakening bullish momentum. Furthermore, the MACD is on the verge of a bearish crossover, which, if confirmed on a daily basis, would signal a potential downtrend and suggest sell opportunities.


