The spring housing market is still trying to spring.
Pending home sales inched up for the week with small gains but remained below numbers seen at this time last year. New listings volume is trying to grow with its biggest week since September. List prices inched up for the week, though sales prices did not advance.
There are plenty of weak signals in the housing market, of course. The unsold inventory of homes on the market across the country is 28% greater than last year at this time. Withdrawal rates are also much higher than last year. These are the listings that don’t get offers and are just taken off the market. Withdrawals keep a lid on inventory growth.
That suggests a shadow inventory of homes that want to be sold but the market isn’t there for it. Meanwhile, the pending-sale-price-to-list-price ratio is declining at a pace that suggests that any spring homebuyers are acting only when they find a bargain.
Next week on Thursday, March 20, we will hold our monthly webinar where we have the time to dive into all these advanced signals in the data. We have tons of visibility on the spring market and how we’re set up the whole year. The big questions we’re answering now are whether the weak housing market can have any chance of turning around? Are there any signs of sales growing for 2025?
We always take time to look at local markets, including keeping close tabs on the very weak Florida markets but also asking if the Northeast will be able to remain strong like last year.
Click here to register for the March Altos webinar. These are limited to 1000 attendees with attempted registrations exceeding that every month.
HOME SALES
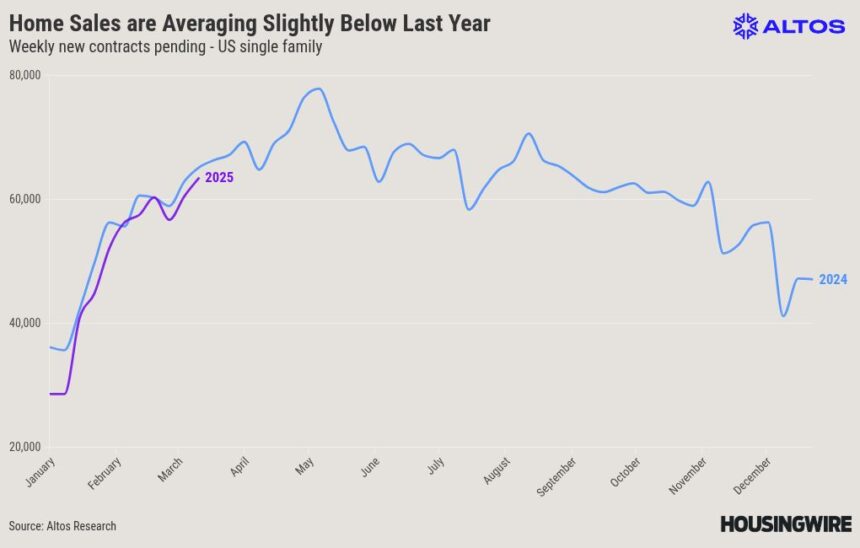
We counted 63,000 newly pending home sales this week for single-family homes. That’s up 5% for the week, though still running a couple percent behind the same week a year ago. It is the most pending home sales since August, so the spring is starting to take shape. But since January, the pace of home sales each week has been running about 3% fewer than a year ago. This year still has fewer home sales than 2024 at this time.
In this chart we have the weekly pending home sales data. See the purple line for 2025 keeps coming in just below 2024. There’s nothing in the data that shows the trend changing yet.
However, we’re at an interesting point in the interest rate cycle. Last year at this time, mortgage rates were heading higher to peak in May at 7.5%. This year rates have been easing down for a few weeks. So right now, with the 30-year fixed rate averaging around 6.6%, that’s below the cost from last year at this time. As mortgage rates move into relatively cheaper territory, we’ll see if the marginal demand picks up in the next few weeks and maybe lifts the pace of sales above those from 2024.
Last year, the second quarter was the most expensive moment to buy a home. This year, if current trends hold, we could already be past that point in 2025. If so, that could help home sales finally turn around in the second quarter. Watch this line over the next few weeks.
To be clear, if homebuyer demand patterns hold from last year, that implies that we won’t see a lot of movement in purchases until rates get closer to 6%, like they did in September. So right now, we’re watching only for marginal moves in demand, no one is expecting any big gains in home sales.
The other thing to note with this spring’s market is that the withdrawal rate is pretty high. We calculate that while there were 63,000 newly pending single-family home sales in the week, there were another 20,000 withdrawn listings across the country. That is, they’re no longer listed for sale and they’re not in contract. These could come back on the market as relists later in the year. Something to watch.
HOME PRICES
At HousingWire, we’ve forecasted that U.S. home prices would climb about 3.5% in 2025 over the previous year. Those are pretty low expectations for home price appreciation, but the data hasn’t pointed negative. It’s low, but not negative.
When you make a forecast like that you can ask yourself, ‘If the data changes, or some of our assumptions were wrong, where is the risk? Which direction are we likely to be wrong?’ And if you’ve been paying attention to the weekly housing market data here, you’ll know that the risk right now is to the downside. We are watching for signals that home prices might turn negative nationwide in 2025. Between stubbornly high mortgage rates, and all sorts of new economic chaos that was hard to foresee even a few months ago, we’re watching for signals that housing demand weakens further and home prices drop.
Those signals are not here yet for the national overview. There are plenty of local markets where home prices are below last year at this time. And we’re watching a bunch of home price measures so we can report the exact trends as they happen.
The first price measure to watch is the median price of this week’s pending home sales, which came in at $389,900. That’s unchanged from a week ago. It’s 2.6% above last year at this time. That’s the chart here. We have plotted the pending home sales price curves for each of the past four years. The purple line for 2025 is barely above last year’s blue line. The seasonal market peaks in May before easing back down in the second half of the year.
Year to date, our forecast for home prices is too high. There’s plenty of year left so we are maintaining the forecast of 3.5%. Last year when rates touched 6% in September, the remainder of the year had enough demand to support prices. You can see that in the blue line here. But as of now, home prices are barely above last year. These weekly pending home sales are the earliest proxy for sales that will complete later in March or April. These sales are not yet closed.
The price of the active market listings is $435,000 now. That’s up 1.2% from a week ago and is just fractionally above 2024.
The price of the newly listed cohort came in pretty strong recently at $435,900. This was a jump of 2.5% for the week and is currently 3.7% above last year. These active market listing prices lead the sales prices so they’re very valuable to track.
When a home gets listed for sale in March, the seller and the listing agent use all the information about possible buyers and traffic to price that as most likely to sell. So, we see strength or weakness in the active market prices several months before the sales happen. The signal right now in the active market pricing measures keeps our expectations in the “just-barely-positive” range for the next few months.
PRICE REDUCTIONS
The other leading indicator I like to share each week are the price reductions. The percent of homes on the market that have taken a price cut from the original list price. Price cuts ticked down 10 basis points to 33.6% this week.
In the chart here we have the purple 2025 line above any recent March. That same pattern is holding from February, with demand not great. Inventory of unsold homes is climbing. Sellers that don’t get an offer either have to cut prices or withdraw the listing and both of those metrics are elevated.
The cool thing about this price reductions metric is that it’s very sensitive to changes in demand. At moments when mortgage rates jump, that means some offers don’t get made, and some sellers cut their price, so this line adjusts very quickly. In a deteriorating market, price cuts move quickly. The signal right now is that while elevated, price cuts ticked down this week. That may be the market reacting to 7 weeks of improving mortgage rates.
Beyond changes in interest rates, I’ll be watching the price reductions for changes in the economy as unemployment grows and perhaps recession looms again. The macro landscape is changing quickly.
NEW LISTINGS
There was a nice jump in the new listings volume this week. There were 64,000 single-family new listings with another 12,000 immediate sales. That’s 76,000 total homesellers in the week. That’s just fractionally more than a year ago, and the most new listings since September. The spring market is trying to emerge.
I have the weekly new listings volume in this chart. Each bar is a week. The taller the bar, the more homesellers. At the left end of the chart, that’s 2021 and 2022. We used to have a lot more homesellers in this country. It’s wild how rapidly homesellers walked away in July 2022. Then we entered the post-pandemic era. This week is the far-right end of the chart. That’s a nice jump this week for March. I’ve highlighted the same week in the last two years. There are slightly more sellers each week now.
In general, I interpret any growth in new listings volume as a good thing for the housing market. In fact, I’d say that year to date, I’ve been disappointed in the growth of new listings. There aren’t enough sellers still in many parts of the country. If we’re lucky, we get several more weeks of new listings growth in March.
INVENTORY
As a result of all that, the unsold inventory of homes on the market in the U.S. inched up this week by half a percent. There are now 642,000 single-family homes unsold on the market. That’s a little nudge up, and we’re expecting a bigger increase in next week’s data.
That could be a 1% increase per week in inventory as we move into March and April. When the market is really slowing, like it was in 2022, then inventory might climb 2% per week. I don’t see that happening now. But inventory should be on the way up for the spring.
In this chart each line is a year. Most years have pretty strong inventory growth in March, April and May. This year-over-year chart shows how as inventory increases this year, we’ll get very close to the old normal levels of unsold inventory. With greater supply on the market, that implies better selection for homebuyers and less upward pressure on home prices. There are 7 or 8 states that have more inventory than 2019.
Interestingly, the number of states with more inventory than before the pandemic hasn’t changed in months. Texas and Florida have a lot more inventory unsold than a few years ago. Those are the two biggest housing markets. The rest of the country is still catching up. In the webinar next Thursday, March 20, we’ll do a state-by-state analysis of the inventory trends.
If you need to communicate about this market with your buyers and sellers, join us at Altos Research.