


- Bitcoin’s price swings highlight how market sentiment shifts rapidly, with fear-driven sell-offs often preceding strong rebounds and rallies.
- Key indicators like the Long-Term Realized Cap suggest Bitcoin’s uptrend could continue unless a critical support level breaks.
Bitcoin’s recent bounce to $84,500 has once again highlighted how market sentiment swings wildly. Just days ago, prices dipped to $78,000, triggering widespread bearish sentiment, according to a recent report by Santiment. Many traders braced for further declines, convinced that the correction would deepen. Yet, as history has shown, fear-driven sell-offs often precede strong rebounds.
A similar scenario played out in February, when pessimism peaked, only for Bitcoin to rally in early March. This repeating cycle underscores a fundamental truth: Bitcoin tends to move contrary to popular expectations. Retail traders often react emotionally rather than strategically, reinforcing the classic pattern of fear leading to bottoms and greed leading to tops.
For the past month, Bitcoin has hovered within a crucial range, neither slipping below $70,000 nor breaking the highly anticipated $100,000 mark. This price region acts as a psychological battleground. Calls for sub-$70,000 levels tend to signal excessive fear, while predictions of $100,000+ often indicate a growing wave of greed.
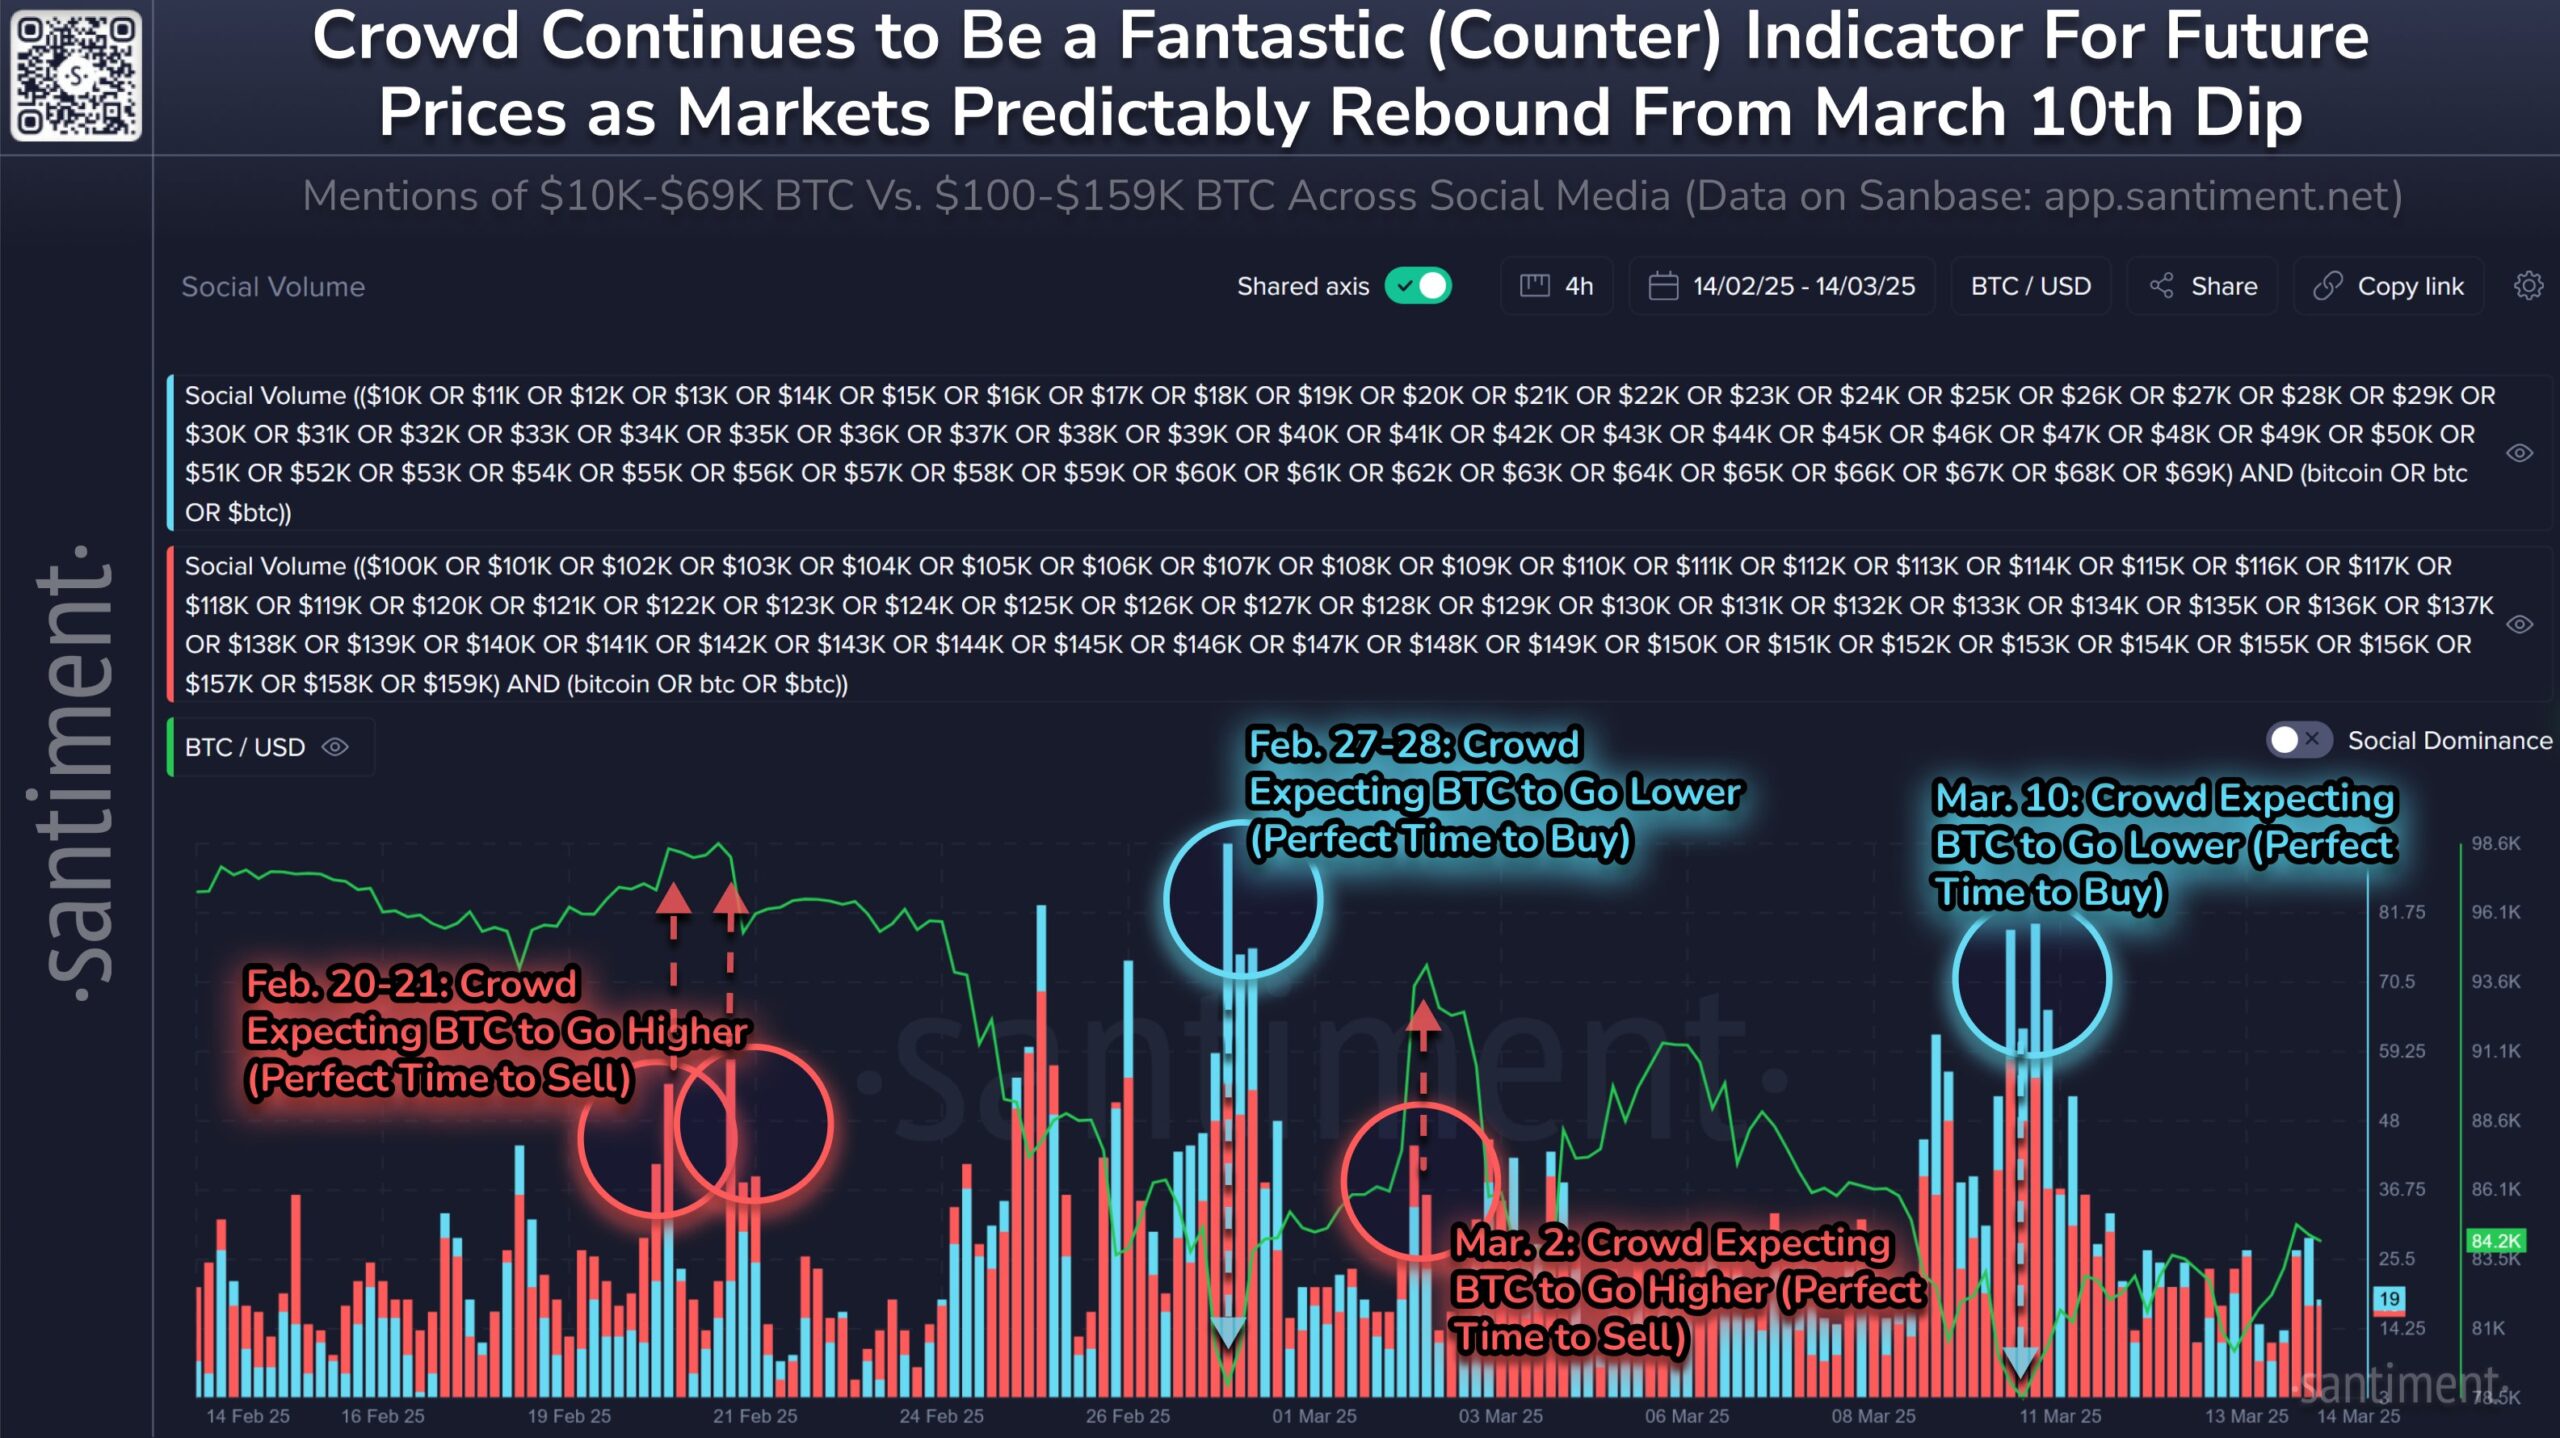
Bearish Sentiment at $10K-$69K Precedes Strong Rallies
Social media has become a hub for market sentiment, but often, these opinions are contrary indicators. Historically, bearish forecasts in the $10,000-$69,000 price zone have preceded strong rallies. Conversely, when traders start throwing out bullish targets between $100,000 and $159,000, corrections usually follow.
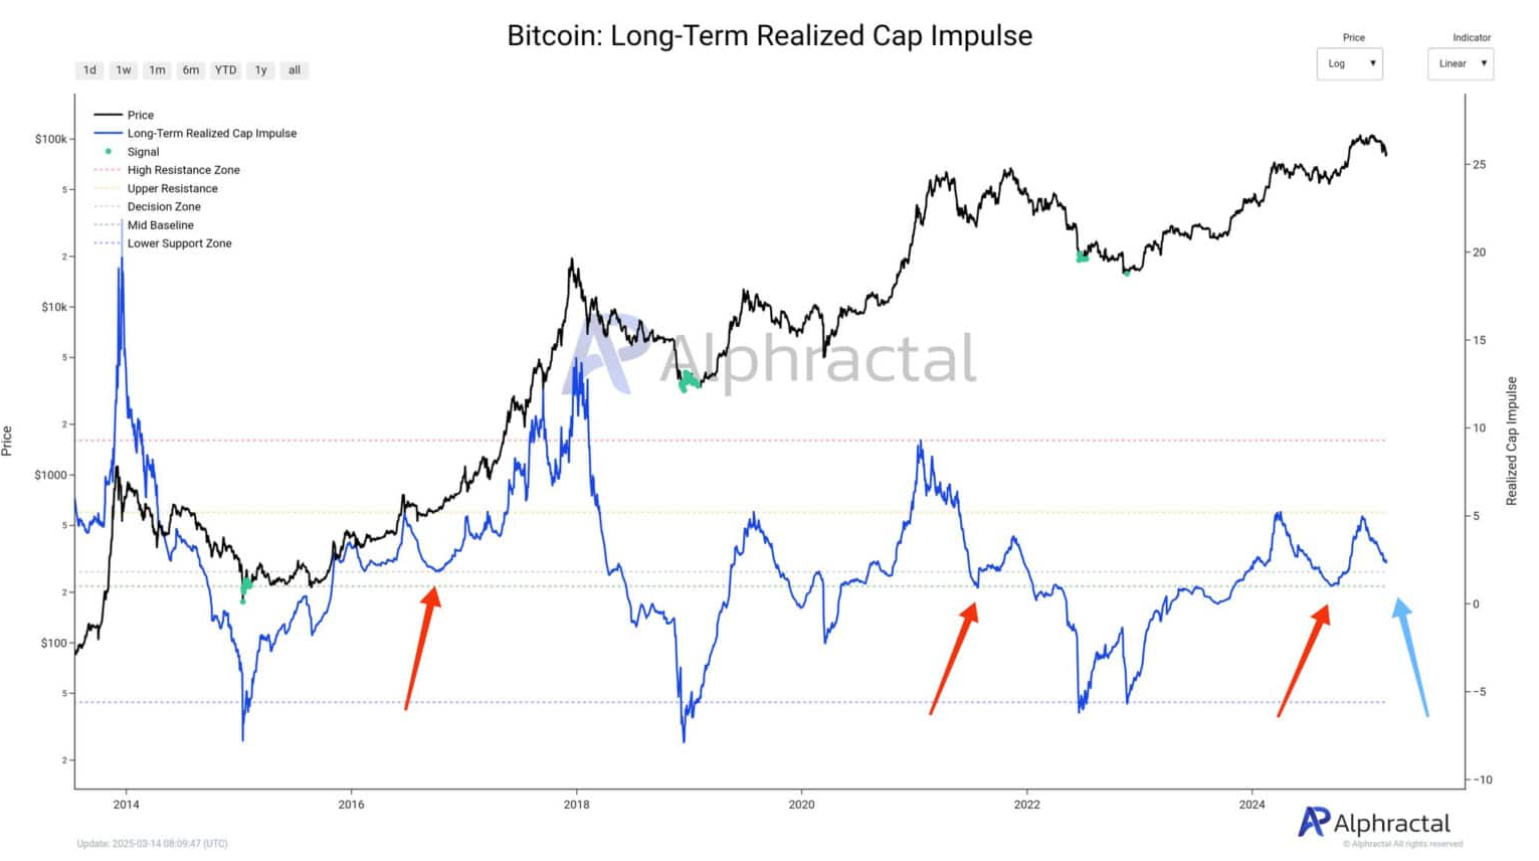
A key indicator, the Long-Term Realized Cap metric, is currently at a critical juncture. This metric tracks capital flows over extended periods and has been a reliable support level in past bull markets. If Bitcoin holds this level, the uptrend could continue. However, if it breaks, it may signal the start of a prolonged downturn.
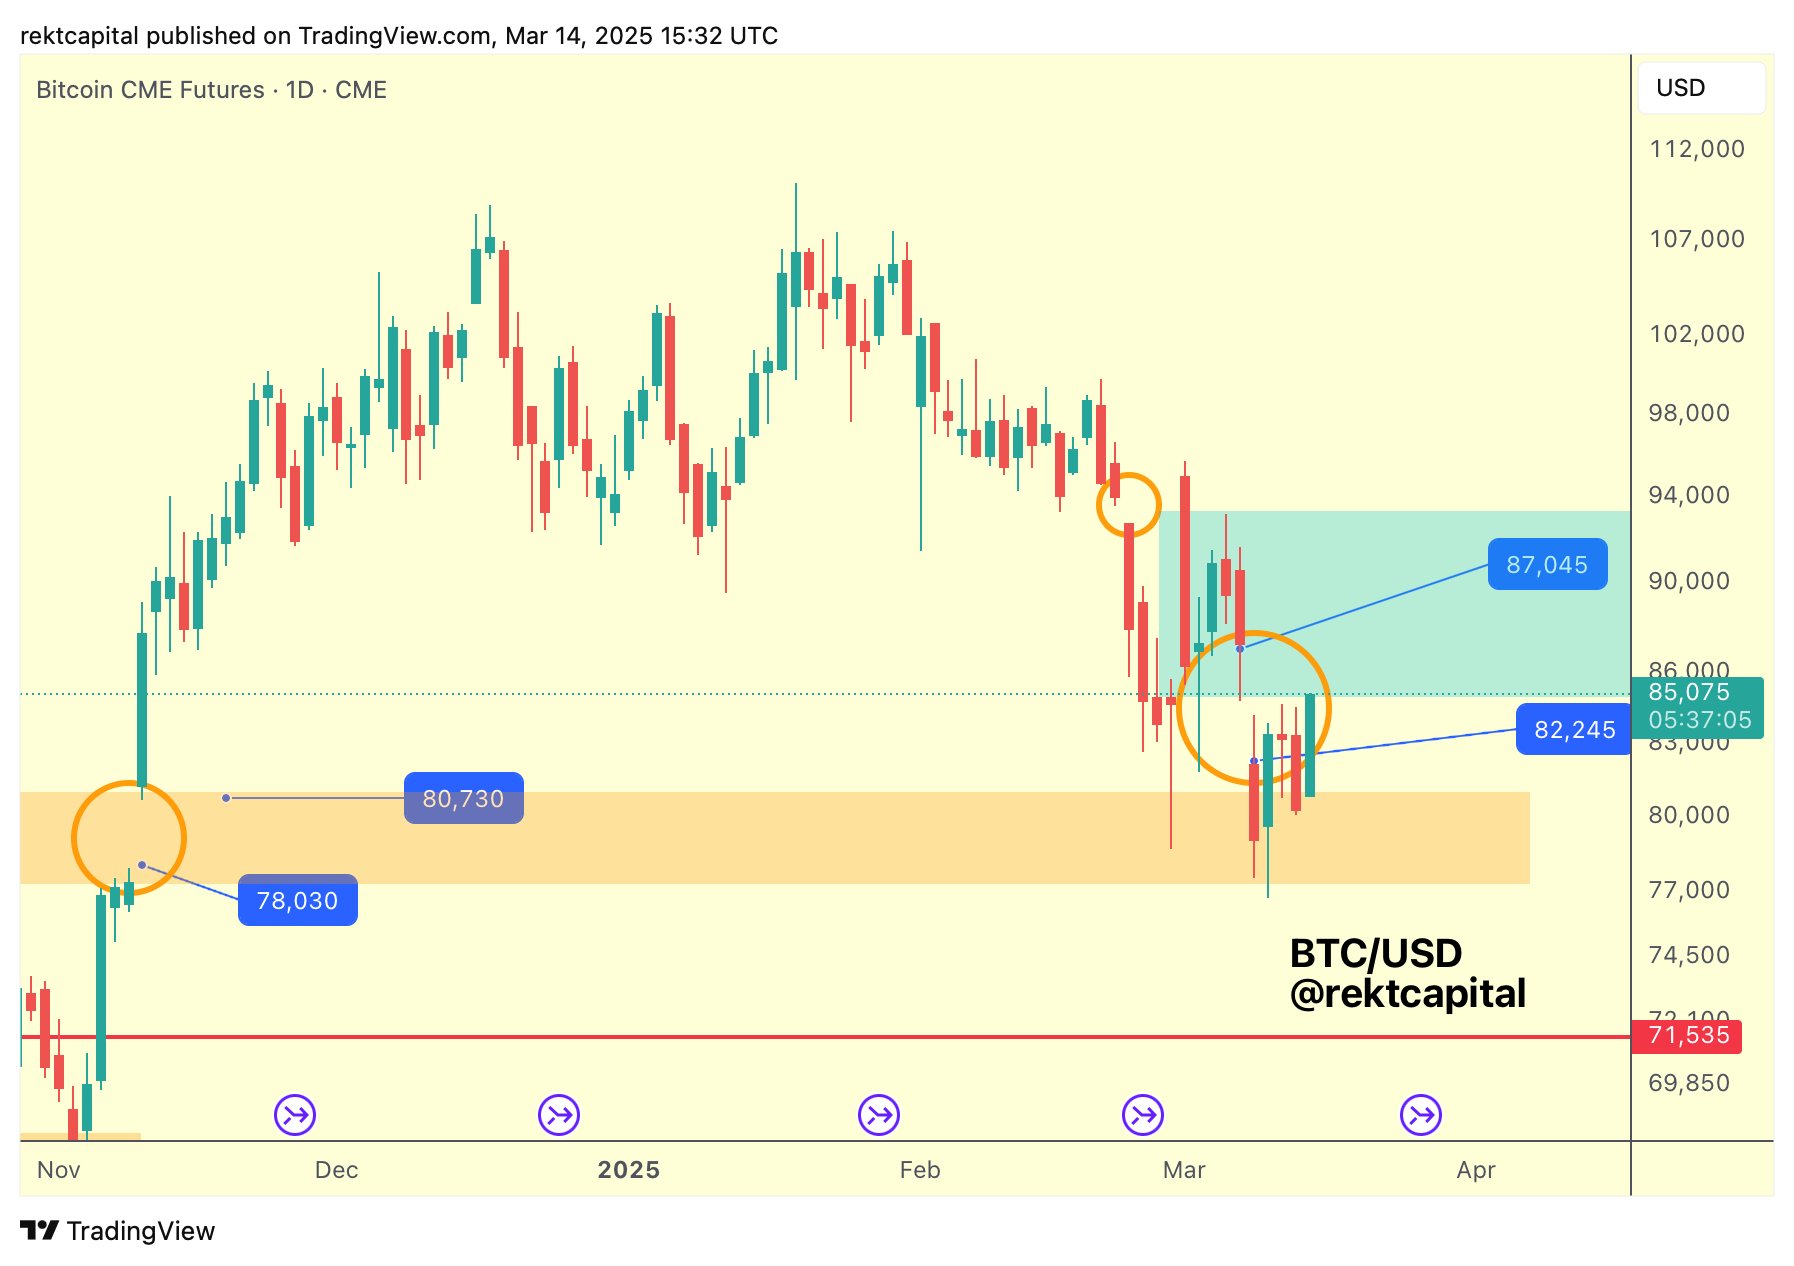
Crypto analyst Rekt Capital weighed in on the technical side of things. He pointed out that Bitcoin’s price action was filling the CME gap between $82,245 and $87,000, hinting at further upward momentum. He noted, “the signs for a weakening resistance were there,” reinforcing the idea that a decisive break above resistance could fuel additional gains.
Capital Flows and Market Structure
Beyond short-term price swings, deeper structural trends provide a clearer picture of Bitcoin’s market strength. The Long-Term Realized Cap Impulse, which tracks the movement of capital over extended periods, offers insights into supply and demand. Unlike daily fluctuations driven by hype and fear, this metric highlights underlying shifts in market structure.
Whether Bitcoin is in a sustainable uptrend or facing an impending correction, if the price holds steady above this threshold, the rally could gain further traction. A breakdown, however, could lead to an extended market downturn.
Sentiment extremes remain one of the most influential forces in Bitcoin’s price movement. Fear often creates prime buying opportunities, while excessive optimism tends to precede corrections. Understanding this dynamic is crucial for traders looking to navigate the market effectively.
