- From November 2024 to April 2025, Algorand’s price action formed a bull flag pattern, a signal for upward continuation.
- ALGO’s reduced volatility, paired with historical patterns of major rallies after stabilization, points to a likely increase in price action.
Algorand (ALGO) recently showed its fast-performance blockchain strength, processing 34,008 transactions in one block in less than three seconds with a 100% success rate. This efficiency record revitalized the attention for ALGO as it came at the time of bullish technical indications that pointed towards a possible price breakout.
Bull Flag Formation Indicates Breakout Potential For Algorand Price
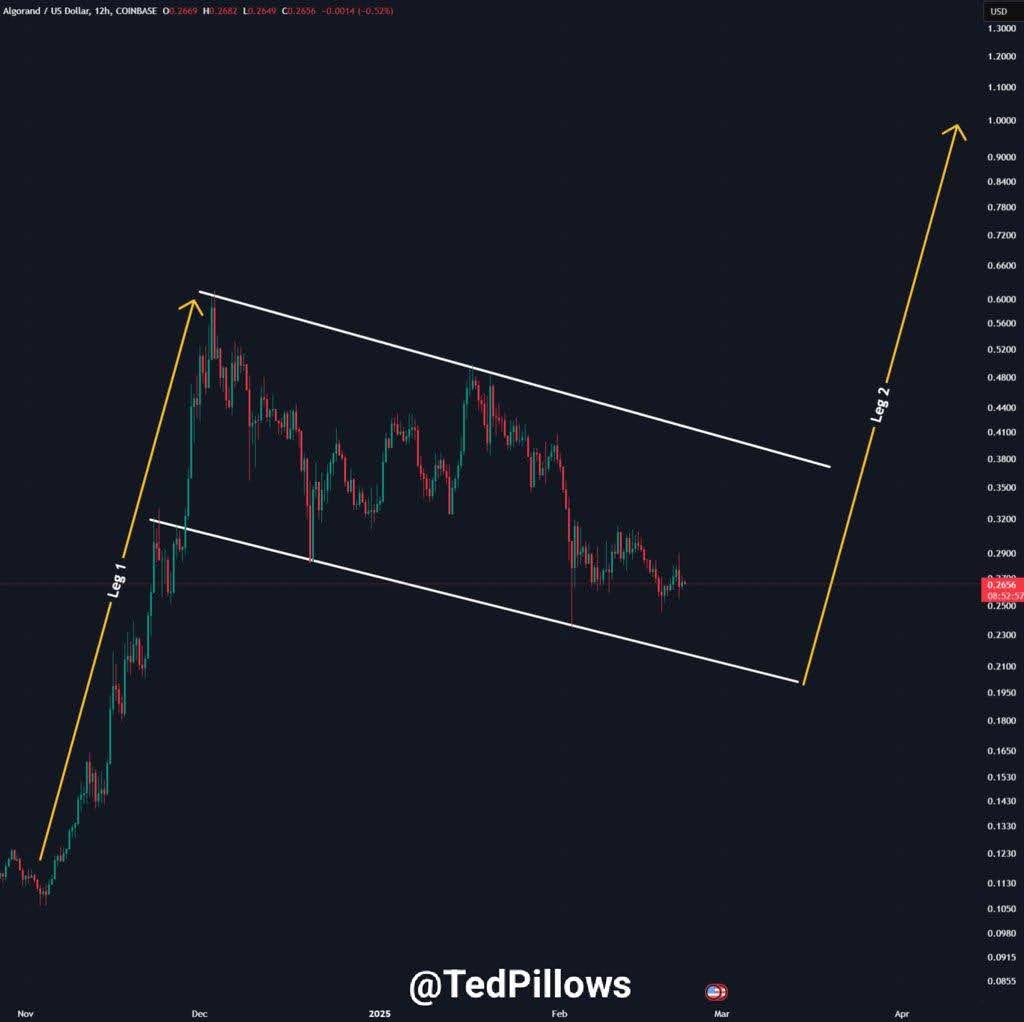
From November 2024 to April 2025, ALGO price action displayed a bull flag pattern, which is one of the most popular formations to signal upward continuation. The first part of the pattern displayed a steep price rise, followed by consolidation.
Technical indicators indicated that Algorand price was preparing for a move towards the $0.3000 level, as evidenced by directional indicators on the price chart., as reported previously.
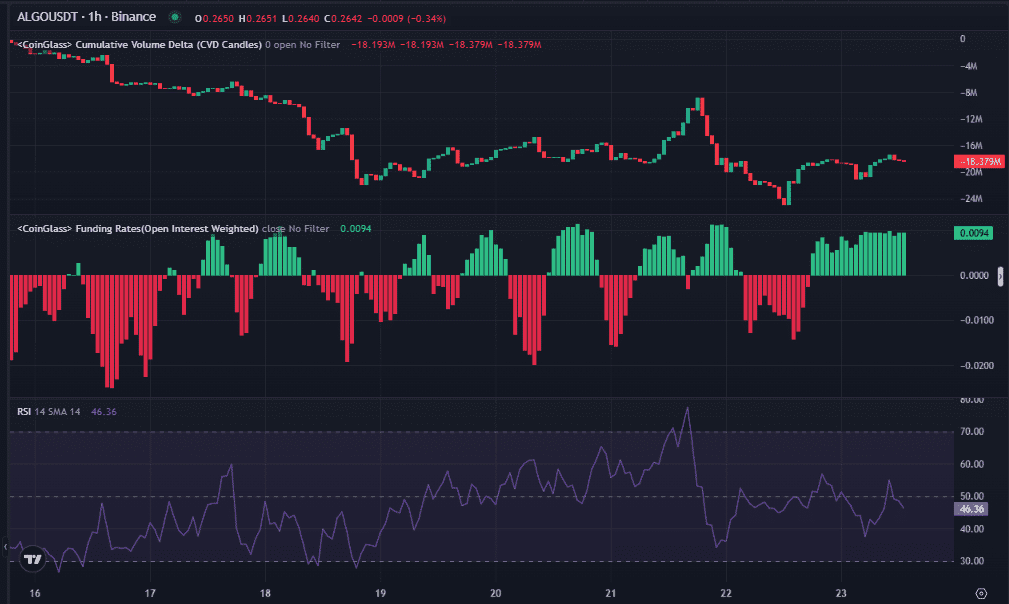
Lower volatility in the consolidation phase indicated that traders were building up ALGO, which supported the breakout potential. According to TradingView, to support this view, the Relative Strength Index (RSI) on the one-hour chart rose from 37 to 54 before plunging back to 48 at the time of writing. This rise showed increasing momentum, with the RSI crossing the 50 level, a typical sign of bullish sentiment.
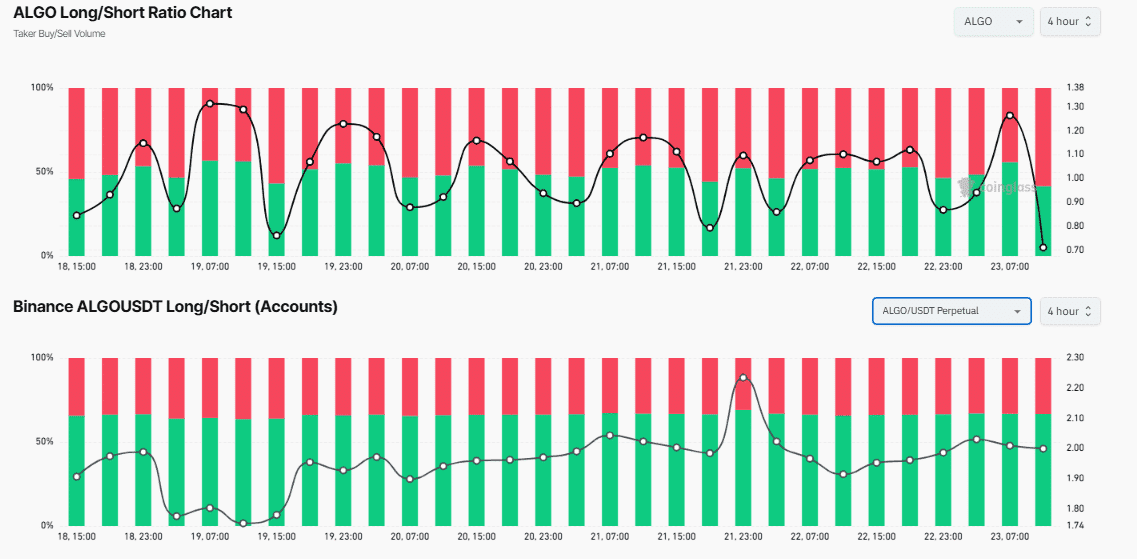
Whilst, statistics from ALGO’s derivatives market supported the optimism. The Long/Short Ratio, examined over a period of four hours, indicated a rising level of longs. The Taker Buy/Sell Volume ratio hit an apex around 1.3, emphasizing traders’ inclination to buy over selling.
Moreover, Algorand’s Long/Short Accounts Ratio was around 2.0, indicating that there were more traders betting on a move up. This information was consistent with the current accumulation phase in the bull flag formation, reinforcing the expectation of a price breakout.
Other Technical Indicators Show Positive Signs
On February 23, 2025, ALGO’s 30-day volatility was 87.41%, lower than its high of 130.94% on February 4. The volatility low of 84.18% on February 19 indicated that ALGO was in a stabilization phase. Past price action from 2019 to 2025 showed that ALGO tended to have major rallies after episodes of contained volatility.
Comparison with previous market cycles showed that Algorand’s significant price rallies, such as those seen from 2020 to mid-2021, coincided with spikes in volatility. The recent volatility drop indicated that traders were positioning, a typical lead to more market activity. If the volatility increases once more, ALGO may experience renewed price action, which may confirm the bull flag breakout.
Over the last 15 hours, ALGO’s Cumulative Volume Delta (CVD) and Funding Rates again added to positive market sentiment. The CVD had a net positive delta with a growing number of green bars, indicating continuous buying demand, as mentioned in our previous news article.
At the same time, ALGO’s Funding Rate was 0.0094, which meant that investors were paying a premium to hold long positions. The convergence of a rising CVD and RSI indicated persistent buying pressure, raising the chances of further upward momentum.