
There are some really interesting price trends happening across the country right now. I mentioned last week how weakness in demand had led some of the measures for home price changes to slide into negative territory compared to a year ago. This week, another signal of future sales prices slipped in a bit of a surprising way, another factor showing weakness in homebuyer demand and weakness in price trends.
These are not catastrophic signs. Inventory of unsold homes on the market ticked down fractionally this week. There are fewer homes for sale now than a week ago. It’s not uncommon for January to have a little up and down in the inventory numbers. If inventory were jumping each week, that would be notable, but it’s not.
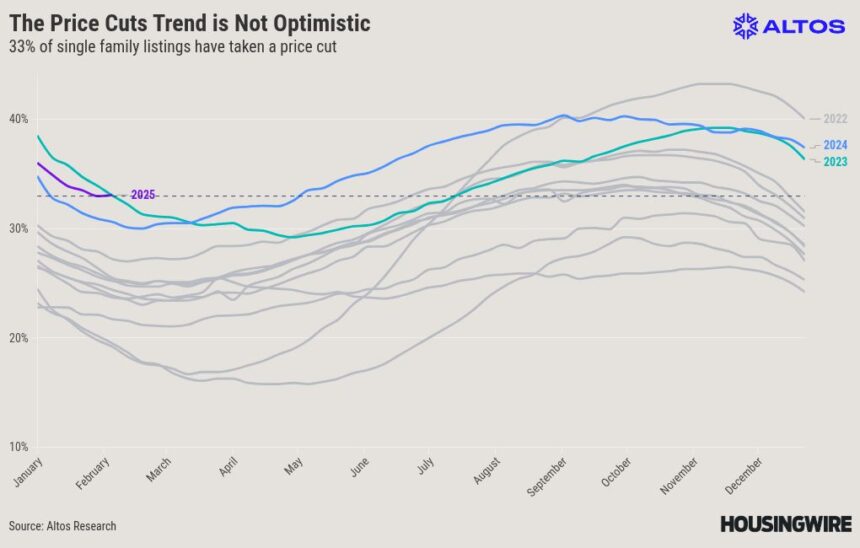
As inventory builds and, as there are fewer offers from homebuyers, more sellers feel the need to reduce the asking price of the homes for sale. Price reductions ticked up this week, which is unusual for the last week of January.
Let’s take a look at the data for the final week of January 2025.
Price reductions jump
In recent weeks, I’ve shared how the data shows weakness for home prices. Prices are not falling or crashing, but most of our home price metrics are barely positive from last year at this time. Essentially home price appreciation is flat vs last year at this time.
We regard this metric, the percentage of homes on the market with price reductions from the original list price, as a leading indicator for future sales prices. Looking backward at the housing market, we can see sales prices are not appreciating compared to 2024. Looking forward, we see weakness too in future transactions.
Price reductions actually inched up this week by 10 basis points. About 33.1% of the homes on the market have taken a price cut from the original list price. That’s up from 33% last week. It’s a pretty small move, but it’s in the wrong direction. Almost always this early in the year, price cuts are declining. Normally, fewer folks need to cut their price in the spring. At this time, of year there’s new inventory and new buyers are shopping. In recent weeks, we can see that those buyers are waiting. Sellers who don’t get an offer may choose to cut their price. So normally there would be fewer price reductions at this time of year. But this week price reductions ticked up.
And notably, this is the first instance of an uptick in price reductions in January in over 10 years.
There are few offers being made right now, so more sellers are finding the need to reduce their asking price. That trend is likely to continue until mortgage prices come back down.
Home prices contract
The median price for home sales contracts entered this week was at $389,700. That’s up a percent for the week and is 2.5% more expensive than home sales in the same week a year ago. In the scale of housing, 2.5% is basically zero. While there are plenty of markets that have home price gains from a year ago, there are also a lot of markets where home prices are declining.
This week saw a little uptick in the active market so the median price for all the homes on the market is now $424,900 which is exactly unchanged from a year ago.
This might reverse the trend and push home prices higher in 2025.
Consider a scenario where the government follows through with these tariff threats, and at the same time reduces government spending. A shrinking U.S. economy would likely push bond yields lower. Lower yields on the 10-year treasury leads to lower mortgage rates. This is the scenario that happened in 2019 in the last tariff trade war. The economy slowed, so rates fell. By early 2020, mortgage rates were pretty low. By the time the pandemic hit, the housing market was already heating up.
I don’t have any ability to predict which of the taxes get enacted or whether they stay enacted. I don’t have a view on how dramatically the financial markets react. One side effect of chaos is bond yields fall. Wouldn’t that be an ironic headline? “As the economy tanks, home prices soar!”
We continue to expect a little climb in this number over the next few months as the prime days of the home buying season are still to come. Even in a weak demand environment, home prices will lurch higher in the spring. Home sales tend to cluster around the big round numbers, and you can see the cap here at $400,000 last May. Because of this clustering effect, it’s hard to see the market busting past that plateau this year.
Inventory is a teeny bit lower than last week
There are 635,000 single-family homes unsold on the market now. That’s actually a tiny fraction fewer than a week ago. It’s not uncommon for inventory to bounce up and down a bit in January, bouncing along the bottom before inventory starts building in earnest for the spring. It seems like we’ve already passed the low point of inventory for the year. That’s very early in the year for supply to start growing. Our down moves are smaller, the up-ticks are bigger than they have been in a long time.
We can see the same dynamic that’s driving the price reductions driving inventory. There are a few more sellers each week, but the demand is light, so inventory continues to build. There are 27.7% more homes on the market now than a year ago.
This isn’t a new trend but it is maybe a little faster than we anticipated. We’ve forecasted 15% gains in inventory for the calendar year 2025 over 2024. The current forecast model is showing 17% gains by the end of the year.
New listings drop
There were just under 49,000 new listings unsold for single-family homes this week. That’s actually fewer than a week ago though it’s still 10% more than last year at this time. When we include the new listings already in contract to be sold, it totals almost 4% more sellers than a year ago. That’s a little disappointing, to be honest. I am hoping for 5-10% seller growth each week. I believe that would be healthy for transactions.
In this chart the purple line at the far left is the 2025 year taking shape. Each week has more sellers and more homes unsold newly listed than a year ago. Last year’s line is in blue here. That growth is pretty consistent.
It’s still not a lot of sellers. The gray lines are past years and while 2025 has more than 2024, it’s still fewer sellers than in years past. In the fifth week of the year in 2020 for example, just before the pandemic hit, we counted nearly 74,000 new listings. That 50% more sellers than we had this week.
The takeaway for the new listings data is that while seller volume continues to inch higher that’s a good thing and the market coulduse even more sellers.
Pending home sales are restricted
Ultimately home sales are restricted in the same way that new listings are restricted. We’re moving less. We’re moving less across town and moving less across the country. I’ve been expecting this trend to ease a bit in 2025, with a slight resumption of people moving to the sunbelt. But the trend is barely budging so far.
There were 56,000 newly pending home sales this week. That’s a nice nearly 8% increase fro the week prior. This is the time of year when you’d expect home sales to grow each week. So that’s good. In fact, home sales were actually a tiny fraction higher than last year at this time. There were 1% more sales than the same week a year ago. Sales have been averaging nearly 5% fewer than at the start of 2024. So I guess any positive reporting is good news?
That’s what we’re looking at with this chart. The 2025 purple line has been trending lower than the 2024 blue line. This week bucked the trend with a little positive move to 56,000 new contracts started.
In total, there are now 282,000 single-family homes in contract. That’s 3.5% fewer than a year ago. There are fewer sales pending now than last year at this time. These are sales that will mostly close in February, so by our count the February home sales headlines when they’re released in a few months, will be pretty bearish on sales.
Who knows what happens with the timing of mortgage rate moves during the year, but if we’re lucky, maybe by summer mortgage rates have eased, so 2025 shows a gain in home sales at that time. That’s just speculation but it’s something to watch for later in the year.
Mike Simonsen is the founder of Altos Research and will be a featured speaker at the Housing Economic Summit in Dallas on Feb. 26. Learn more here.
