

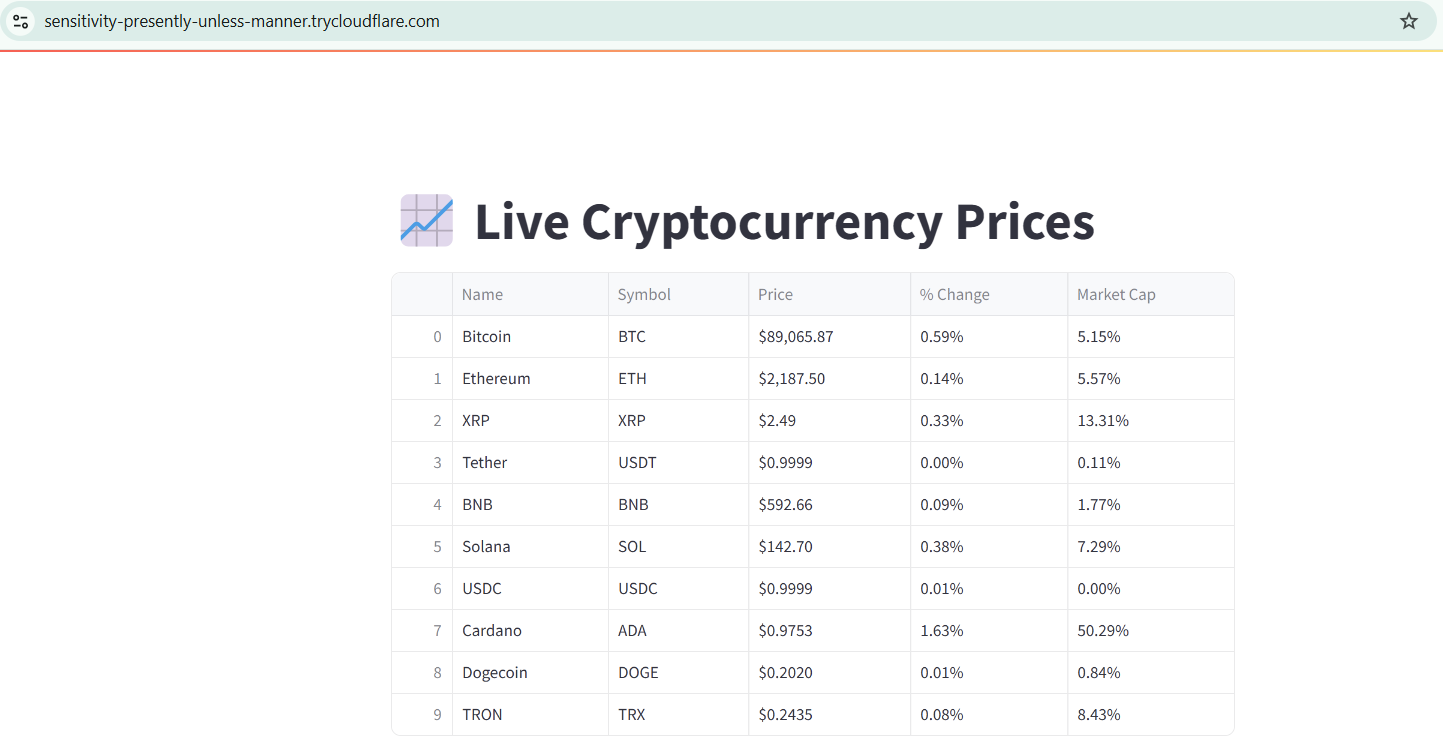
In this tutorial, we’ll walk through a reliable and hassle-free approach using Cloudflared, a tool by Cloudflare that provides a secure, publicly accessible link to your Streamlit app. By the end of this guide, we will achieve a fully functional cryptocurrency dashboard that dynamically scrapes and visualizes real-time price data from CoinMarketCap. You can track the top 10 cryptocurrencies, compare their prices and market capitalizations, and view interactive charts for better insights.
!pip install streamlit requests beautifulsoup4 pandas matplotlib plotly
!npm install -g localtunnel
First, the above command installs the necessary dependencies for building and deploying a Streamlit-based cryptocurrency dashboard. The first command installs essential Python libraries like Streamlit for the web app, BeautifulSoup4 for web scraping, Pandas for data manipulation, and Plotly for interactive visualizations. The second command installs LocalTunnel, which creates a public URL for accessing the Streamlit app from Colab.
%%writefile app.py
import streamlit as st
import requests
from bs4 import BeautifulSoup
import pandas as pd
import plotly.express as px
# Function to scrape cryptocurrency prices
def scrape_crypto_prices():
url = "https://coinmarketcap.com/"
headers = {"User-Agent": "Mozilla/5.0"}
response = requests.get(url, headers=headers)
if response.status_code != 200:
return pd.DataFrame(), "Error fetching data."
soup = BeautifulSoup(response.text, "html.parser")
rows = soup.select("tbody tr")[:10] # Get top 10 cryptocurrencies
data = []
for row in rows:
columns = row.find_all("td")
name = columns[2].find("p").text # Crypto name
symbol = columns[2].find("p", class_="coin-item-symbol").text # Symbol
price = columns[3].text # Price
change = columns[4].text # % Change
market_cap = columns[6].text # Market Cap
data.append([name, symbol, price, change, market_cap])
return pd.DataFrame(data, columns=["Name", "Symbol", "Price", "% Change", "Market Cap"]), None
# Streamlit UI
st.title(" Live Cryptocurrency Prices")
data, error = scrape_crypto_prices()
if error:
st.error(error)
else:
st.dataframe(data)
data["Price"] = data["Price"].replace({"$": "", ",": ""}, regex=True).astype(float)
fig = px.bar(data, x="Symbol", y="Price", color="Name", title="Top 10 Cryptos by Price")
st.plotly_chart(fig)
fig_market_cap = px.pie(data, names="Name", values="Market Cap", title="Market Cap Distribution")
st.plotly_chart(fig_market_cap)
# Footer
st.markdown("
Live Cryptocurrency Prices")
data, error = scrape_crypto_prices()
if error:
st.error(error)
else:
st.dataframe(data)
data["Price"] = data["Price"].replace({"$": "", ",": ""}, regex=True).astype(float)
fig = px.bar(data, x="Symbol", y="Price", color="Name", title="Top 10 Cryptos by Price")
st.plotly_chart(fig)
fig_market_cap = px.pie(data, names="Name", values="Market Cap", title="Market Cap Distribution")
st.plotly_chart(fig_market_cap)
# Footer
st.markdown(" Data scraped from CoinMarketCap. Updated in real-time.")
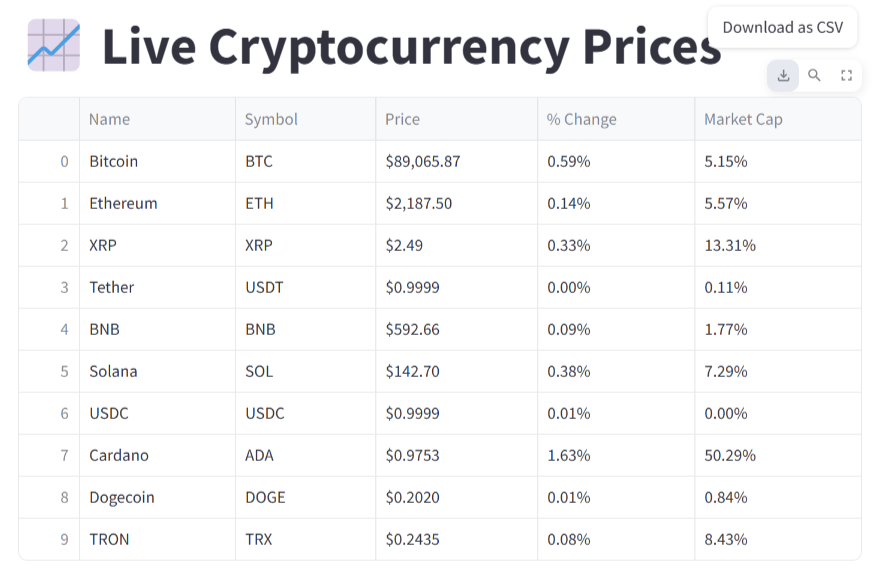
Here, we define a Streamlit web application that scrapes real-time cryptocurrency prices from CoinMarketCap and displays them in an interactive dashboard. It uses BeautifulSoup4 to extract the top 10 cryptocurrencies, including their name, symbol, price, percentage change, and market capitalization. The scraped data is processed using Pandas and visualized with Plotly. The app presents a bar chart for price comparison and a pie chart for market capitalization distribution. The app displays an error message if an error occurs while fetching data. Finally, a footer note indicates that the data updates dynamically from CoinMarketCap.
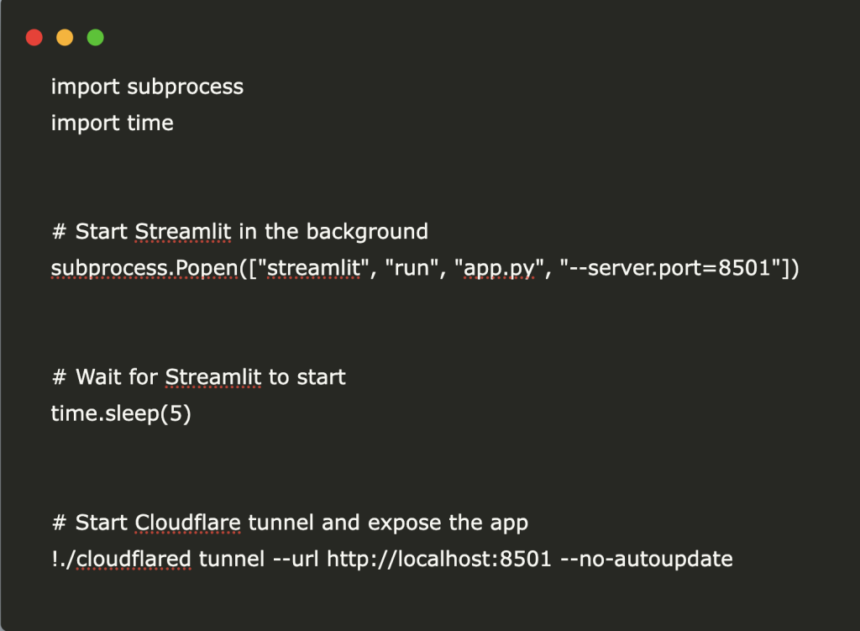
import subprocess
import time


# Start Streamlit in the background
subprocess.Popen(["streamlit", "run", "app.py", "--server.port=8501"])


# Wait for Streamlit to start
time.sleep(5)


# Start Cloudflare tunnel and expose the app
!./cloudflared tunnel --url http://localhost:8501 --no-autoupdate
Finally, the above code launches the Streamlit app in the background using subprocess.Popen and allows it to run on port 8501. A short delay (time.sleep(5)) ensures the app initializes properly before starting the Cloudflared tunnel, which creates a public URL to access the app from Google Colab without authentication or additional setup.
In conclusion, this tutorial provided a step-by-step guide to building and deploying a real-time cryptocurrency tracking app using Streamlit, BeautifulSoup, Pandas, and Plotly. We successfully scraped live crypto data from CoinMarketCap, displayed it in an interactive dashboard, and hosted it seamlessly using Cloudflared. Unlike traditional hosting methods, this approach ensures easy deployment without authentication hassles. Whether you’re a beginner exploring web scraping and data visualization or a developer looking for a lightweight, accessible deployment method, this tutorial equips you with the tools to build and share interactive web apps efficiently.
Here is the Colab Notebook and CSV File for the above project. Also, don’t forget to follow us on Twitter and join our Telegram Channel and LinkedIn Group. Don’t Forget to join our 80k+ ML SubReddit.

The post A Step by Step Guide to Deploy Streamlit App Using Cloudflared, BeautifulSoup, Pandas, Plotly for Real-Time Cryptocurrency Web Scraping and Visualization appeared first on MarkTechPost.