This week has been full of surprising headlines regarding the housing market, particularly concerning President Trump. His executive orders and demand for lower interest rates have overshadowed the usual discussions on housing economics. In this article, I’ll give you an update on the latest weekly housing data but also address what President Trump can or can’t do for housing in these specific areas.
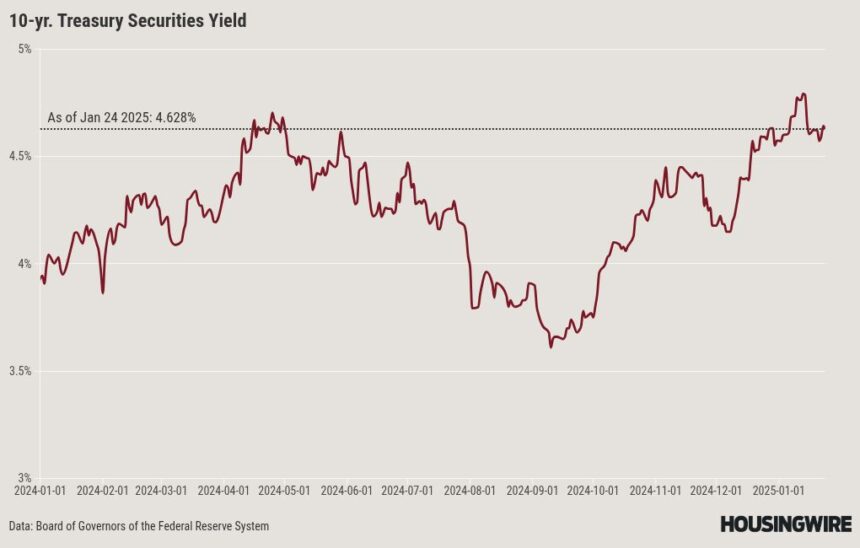
10-year yield and mortgage rates
My 2025 forecast includes:
- A range for mortgage rates between 7.25%-5.75%
- A range for the 10-year yield between 4.70%-3.80%
For all the smoke and jazz that happened last week, mortgage rates were actually very dull. We did get some movement in the 10-year yield the night of the inauguration, but considering all the headlines, mortgage rates didn’t move much up or down last week. For me, the labor market matters most for rates, and the jobless claims data ticked up a bit last week, but between cold weather and the LA wildfires, the market roughly ignored that as well. I addressed Trump’s demand for lower mortgages in this podcast.
To bring mortgage rates lower, President Trump can play the role of a basketball coach working the referee (Federal Reserve Chair Powell) to get a call to go his way, but Treasury Secretary nominee Scott Bessent would have more influence. However, if President Trump keeps pressing the Fed and the labor data does get softer, it can put pressure on the Fed to act quicker.
Mortgage spreads
To make this simple, if mortgage spreads didn’t improve from the worst levels of the spreads we saw in 2023, most likely, we would already be losing construction workers and home sales would not have had the recent bounce in sales from record low levels.
The U.S. housing market would have been much worse without better spreads in 2024 and now going into 2025. If we applied the worst spread levels from 2023 to today’s rates, we would see an increase of an additional 0.79% in the mortgage rate — getting near 8%. On the other hand, if mortgage spreads were at their typical levels, we could expect mortgage rates to be approximately 0.74 to 0.84% lower than they are now, which means mortgage rates near 6%.
Some people have asked me if President Trump has the authority to order someone to purchase mortgage-backed securities in order to improve the spreads, which could then help grow sales with mortgage rates close to 6%. My answer is no. However, we should look to the Treasury, especially if Bessent suggests that the government sponsored enterprises (GSEs), which are still under conservatorship, could use some of their earnings to buy MBS. This scenario is more likely than President Trump requesting funding from Congress to lower mortgage rates.
For my 2025 forecast, I anticipated an improvement in spreads averaging between 0.27%-0.41%, compared to the average of 2.54% in 2024. We are close to reaching that average spread range, and the goal is to improve and maintain better spreads when yields decrease.
Purchase application data
Purchase application data had a mildly positive week, plus 1% week to week, and is plus 2% year over year. So we have a two-week winning streak here.
Last year, this data line was very pessimistic when we had mortgage rates between 6.75%-7.50%, having 14 negative weeks, two positive, and two flat prints week to week.
I am sure President Trump would love lower rates so he doesn’t have to worry about construction workers losing their jobs in his presidency, something I identified as a wild card before 2025 started.
Weekly pending sales
The latest weekly pending contract data from Altos Research offers critical insights into real-time trends in housing demand. The existing home sales reported Friday beat the estimate, but our weekly data has been getting softer recently. I expect this softness to show up in the pending home sales data from NAR soon since the low bar in sales has been uplifted. Still today, we are higher than 2023 levels; if mortgage rates can just head toward 6%, we have growth in sales.
Weekly pending contracts for the past week over the past several years:
- 2025: 266,015
- 2024: 275,559
- 2023: 241,975
Weekly housing inventory data
As we begin 2025, we are closely monitoring the performance of inventory data. Over the past decade, we typically observe the lowest inventory levels in February, as we did last year. However, in the years following COVID-19, the seasonal low began to shift to March and April, which is concerning.
This is one data line that I am sure President Trump loves to see because one of his promises is get more housing supply to the market, and with housing permits at recession levels, the fastest way to get inventory has to come from the existing home sales market.
So far, the inventory data looks promising as we work our way back to the inventory levels of 2019, which were the lowest in five decades before the impact of COVID-19.
- Weekly inventory change (Jan. 17-Jan. 24): Inventory rose from 632,118 to 636,580
- The same week last year (Jan. 19 -Jan 26): Inventory fell from 506,373 to 503,192
- The all-time inventory bottom was in 2022 at 240,497
- The inventory peak for 2024 was 739,434
- For some context, active listings for the same week in 2015 were 938,452
New listings data
Our new listing data reflects homes that come to the market without an immediate contract, providing us with a real-time view of any selling pressure in the market. Over the past five years, we have seen the lowest activity levels in history.
Last year, I anticipated we would reach a minimum of 80,000 new listings during the seasonal peak weeks, but that did not happen; I was off by roughly 5,000. From 2013 to 2019, the seasonal peak weeks recorded between 80,000 and 110,000 listings. Unfortunately, the last two years have seen the lowest levels ever recorded.
During the years of the housing bubble crash, this data line ranged between 250,000 and 400,000 per week. However, we had stressed credit sellers back then, which is not the case now. New listings last week over the past several years:
- 2025: 50,955
- 2024: 44,921
- 2023: 42,843
Price-cut percentage
In an average year, it’s common for about one-third of all homes to see a price cut, reflecting the usual dynamics of the housing market. We are in the seasonal decline period for price cuts; we are now lower than in 2023 but higher than in 2024.
Price cut percentages for last week over the previous several years:
- 2025: 32.96%
- 2024: 31%
- 2023: 34%
The week ahead: Fed Week with tons of economics data
It’s Fed week! After President Trump’s remarks about interest rates last week, we can expect interesting questions and answers following the Fed announcement this week. This week, we also have a lot of economic data to look forward to, including new home sales, home prices, PCE inflation and some bond auctions. As always, jobless claims data will be released on Thursday. Notably, we did see an increase in claims last week.
This week, also keep an eye on pending home sales data; upcoming reports will show the softness reflected in our weekly pending contract data.


